
ObservePoint Debugger Chrome 插件, crx 扩展下载

Troubleshoot analytics tags, variables, events, cookies, and more. Supports Adobe Analytics, Google Analytics, and thousands more.
ObservePoint’s Debugger is a free Chrome Extension for troubleshooting analytics and marketing tags on your live website. Debugger captures page-load and event-triggered requests for marketing and analytics tags and parses them into a human-readable format for easy tag or cookie debugging.
ObservePoint's Debugger is the first step towards comprehensive and efficient governance of your analytics, marketing tags, and cookies. ObservePoint’s full platform of web governance solutions can help you:
? Scan batches of pages or sequences of actions to verify accurate data collection
? Monitor your live implementation for errors in analytics tracking and variable formatting
? Test analytics in development and staging environments before releasing to production
? Simulate important customer journeys to test for obstacles in conversion paths
? Identify and locate cookies set by tags
? Receive notifications whenever your implementation fails expectations
Get a free trial to see how ObservePoint can help you automate and scale analytics testing, privacy monitoring, and experience validation on your entire website: https://www.observepoint.com/free-trial/
:: More Details About The ObservePoint Debugger ::
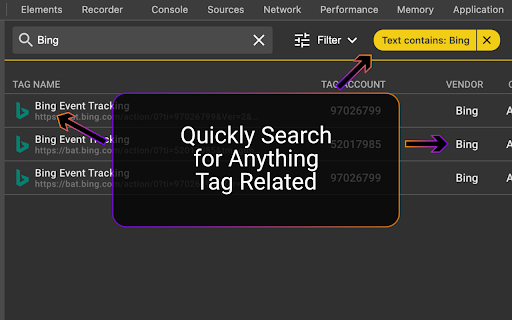
Debugger is designed to help you debug analytics and marketing tags on a page-by-page basis. After installing the Debugger extension, you will see a new tab in your Chrome Developer Tools. Simply open this tab, refresh the page, and see which marketing and analytics tags and cookies are firing on your website.
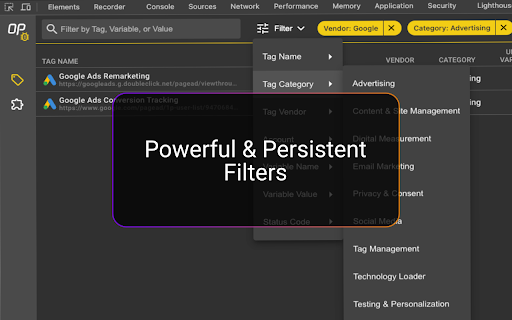
For each tag, you will see the following information:
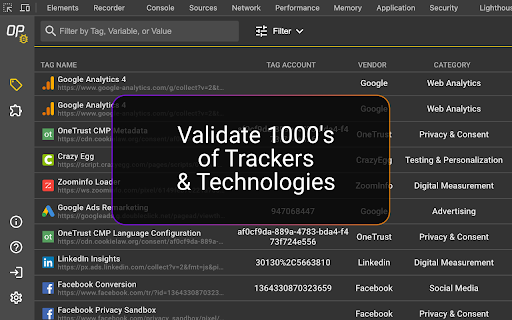
? Tag Name (e.g. Google Analytics 4, Adobe Analytics, Ensighten, OneTrust CMP Banner)
? Account (e.g. op-prod, G-299302931)
? Category (e.g. Analytics, Advertising, Social, Tag Management)
? Status (standard HTTP response codes)
? Request size/Response size
? Total Time/Latency
? Cookies Set by the "set-cookies" Header
:: Basic Debugging ::
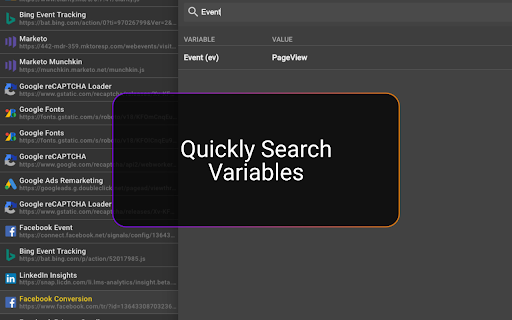
Clicking into each tag allows you to see the network request formatted as an easy-to-read list of variables and cookies set by the tag. You can also view the actual request in both its HTML-encoded and decoded formats.
To clear the log, simply click the “Clear Collected Data” button at the top right of the extension’s interface.
:: Debugging On-Click Events and Cross-Domain Tracking ::
By default, Debugger retains the log of requests when navigating to a new page. By toggling the "Preserve log" option in the extension’s interface, users can make the log clear when moving from page to page. This may hinder troubleshooting on-click events and cross-domain tracking.
:: Downloading Data ::
Users can download an Excel file of each tag by clicking on the “Export data” button at the top right of the interface. This data will appear in your Downloads folder as a file named OP_Debugger_Results_[CURRENT-DATE].xslx.
:: Get Started ::
Debugger is an excellent alternative for anyone who may currently use one or more of the following solutions: WASP, Charles, Fiddler, OmniBug, Adobe Debugger, or Tag Inspector.
To use this extension, follow these five easy steps:
1. Ensure the extension is enabled by selecting More Tools from the Google Chromes’ ellipses menu, then selecting Extensions, and verifying the ObservePoint Debugger is enabled.
2. Open the Chrome Developer Tools:
--On Windows and Linux, press Control-Shift-I or F12.
--On Mac, press Command-Option-I.
3. Select the ObservePoint panel.
4. Refresh the page you are on.
5. Click on a tag to start debugging.
By installing this extension, you agree to the ObservePoint Terms of Service at http://www.observepoint.com/privacy-policy
For more information on the Debugger tool, visit: https://help.observepoint.com/en/articles/9113174-observepoint-tag-debugger-chrome-extension
| 分类 | 💻开发者工具 |
| 插件标识 | daejfbkjipkgidckemjjafiomfeabemo |
| 平台 | Chrome |
| 评分 |
★★★★☆
4.4
|
| 评分人数 | 56 |
| 插件主页 | https://chromewebstore.google.com/detail/observepoint-debugger/daejfbkjipkgidckemjjafiomfeabemo |
| 版本号 | 2.24.242 |
| 大小 | 3.6MiB |
| 官网下载次数 | 30000 |
| 下载地址 | |
| 更新时间 | 2024-12-03 00:00:00 |
CRX扩展文件安装方法
第1步: 打开Chrome浏览器的扩展程序
第2步:
在地址栏输入: chrome://extensions/
第3步: 开启右上角的【开发者模式】
第4步: 重启Chrome浏览器 (重要操作)
第5步: 重新打开扩展程序管理界面
第6步: 将下载的crx文件直接拖入页面完成安装
注意:请确保使用最新版本的Chrome浏览器
同类插件推荐

Ensighten Developer Tools
Ensighten UtilitiesThe Ensighten Developer Tools e

Adobe Experience Cloud Bookmarks
Bookmarks to Adobe Experience Cloud: Analytics, AE

Launch and DTM Switch
Enables the developer to locally override the embe

ObservePoint Debugger
Troubleshoot analytics tags, variables, events, co

Debugger for Adobe Analytics
Prints to JavaScript console what data is sent to

Omnibug
Omnibug is a browser extension to decode and displ

Datalayer Checker
The easiest way to debug and check the dataLayer i

dataslayer
Debug and test tag management (Google Tag Manager,

Adswerve - dataLayer Inspector+
DataLayer Tools for Digital AnalystsThe Adswerve d

WASP.inspector: Analytics Solution Profiler
Digital analytics quality made easy▶ WASP.inspecto
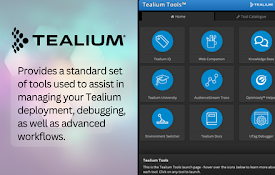
Tealium Tools
Evaluate website data, tags, and events with power

Google Analytics Debugger
Prints useful information to the JavaScript consol

Analytics Debugger
Your Single Source of Truth (SSOT) for debugging a