
FortiManager/FortiAnalyzer Debugger Chrome 插件, crx 扩展下载

Debug a FortiManager/FortiAnalyzer
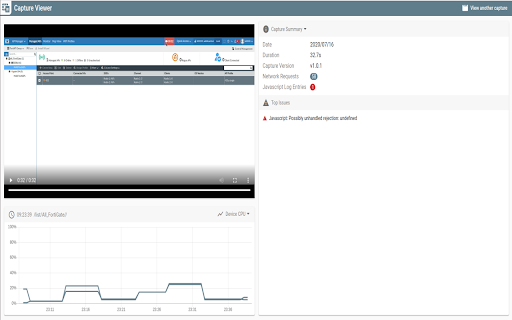
This extension allows for capturing detailed debug information of a FortiManager/FortiAnalyzer's graphical user interface. Requires FortiManager/FortiAnalyzer 6.4.0 GA or greater.
How to use this tool:
1. For capturing:
a. Login to any FortiManager/FortiAnalyzer that is later than 6.4.0 GA, this extension color will turn blue (activated).
b. Click this extension and select "New Capture"
c. update the file name and select "Start Capture"
d. FortiManager/FortiAnalyzer should prompt for permission, select "OK" to start capturing debug information.
e. A red record icon appears in the FortiManager/FortiAnalyzer toolbar.
f. After finishing your operation, click the record icon to stop and download the captured zip file.
2. For viewing:
a. Open this extension and select "View Existing Capture".
b. Open the captured zip file in the newly opened viewer tab.
c. Start the video to view the operation and different captured information.
| 分类 | 💻开发者工具 |
| 插件标识 | dhdlbdcjpkjngafjclfegbbcajbfhlac |
| 平台 | Chrome |
| 评分 |
★★☆☆☆
2.9
|
| 评分人数 | 22 |
| 插件主页 | https://chromewebstore.google.com/detail/fortimanagerfortianalyzer/dhdlbdcjpkjngafjclfegbbcajbfhlac |
| 版本号 | 2.0.2 |
| 大小 | 591KiB |
| 官网下载次数 | 7000 |
| 下载地址 | |
| 更新时间 | 2024-08-22 00:00:00 |
CRX扩展文件安装方法
第1步: 打开Chrome浏览器的扩展程序
第2步:
在地址栏输入: chrome://extensions/
第3步: 开启右上角的【开发者模式】
第4步: 重启Chrome浏览器 (重要操作)
第5步: 重新打开扩展程序管理界面
第6步: 将下载的crx文件直接拖入页面完成安装
注意:请确保使用最新版本的Chrome浏览器
同类插件推荐

Pan(w)achrome
PANW extension for ChromePan(w)achrome is a little

Secret Server Clipboard Utility
Clipboard helper for Secret ServerThe Secret Serve

FortiClient Chromebook Webfilter Extension
FortiClient Chromebook Webfilter ExtensionFortinet
FortiManager/FortiAnalyzer Debugger
Debug a FortiManager/FortiAnalyzerThis extension a

FortiGate Support Tool
Support utility tool for capturing information fro

FortiSASE Secure Web Gateway
Access the internet securely via FortiSASE Secure

SAML DevTools extension
A chrome developer tools extension for viewing SAM

SAML Message Decoder
Collects and displays SAML messagesThis tool helps

SAML Chrome Panel
Extends the Developer Tools, adding support for SA

Fortinet Privileged Access Agent
Fortinet Privileged Access Agent for Google Chrome

Delinea Web Password Filler
Access Platform and Secret Server managed credenti

安全外壳 (SSH)
Terminal emulator and SSH and SFTP client.安全外壳 (SS

Shodan
The Shodan plugin tells you where the website is h