
NIM(Node.js 调试管理工具) Chrome 插件, crx 扩展下载
自动启动Node.js调试窗口
By installing you are agreeing to:
PRIVACY POLICY - https://june07.com/privacy
PLEASE NOTE: Installing this via the Microsoft Web Store does require the sharing of your email address with me (and only me).
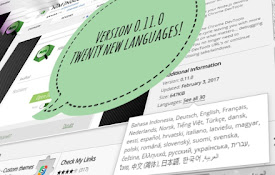
Also note that this is a temporary version which is meant to test the Manifest V3 version of NiM. Once it's clear the MV3 version is stable enough, the now primary Edge Add-ons (https://june07.com/nim) extension will be updated to replace this.
What is NiM? It's "UX sugar" for V8 debugging (Node.js, Deno...) AND MORE. Read more about what I mean here: https://blog.june07.com/more-than/
This Microsoft Extension streamlines your Node.js development.
NiM provides extended capabilities even compared with the new edge://inspect option. Check out what Paul Irish of the Google Chrome team wrote about NiM... https://twitter.com/june07t/status/861664828909264896.
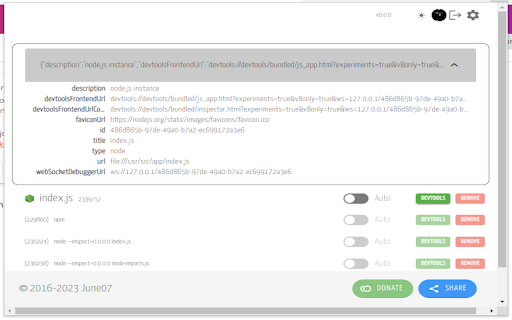
NiM manages the Chromium DevTools window/tab life-cycle leaving you with more ability to focus on what matters... debugging your code. You no longer need to copy/paste DevTools URL's or continue opening/closing tabs/windows.
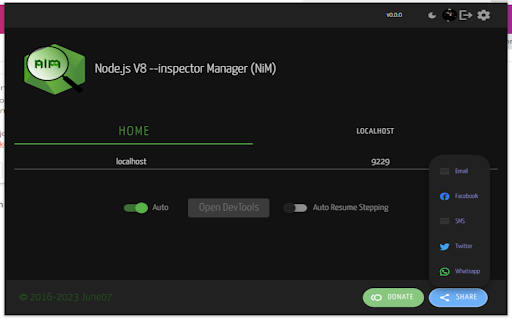
NiM automatically detects the URL that is generated when running node (locally or remotely) with --inspect option. NiM provides you with the option of automatically opening and closing Chromium DevTools in a tab or window. Just toggle the Manual/Auto setting and then start a debugging session. DevTools will open either on clicking the "Open DevTools" button or after the specified timeout period. If set to auto close, once you end your debugging session, DevTools will close automatically.
Features:
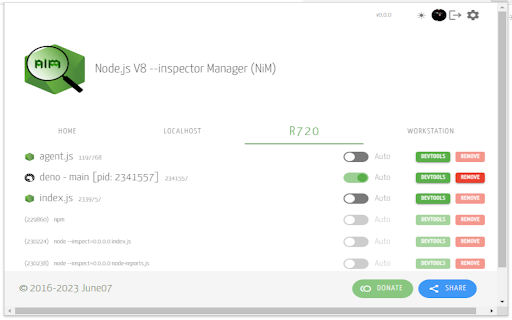
- Manage and monitor Node Diagnostics and Reports
- Manage and monitor local and remote debugging sessions
- Set manual or automatic control of DevTools interface
- Open DevTools in a new tab or window
- Make DevTools focused or inactive on start
- Use custom DevTools bundle
Note: By it's nature this extension requires permissions which
"Read and change all your data on the websites you visit"
Further to better serve and understand my user base the following permission is asked
"Know your email address"
The following URL will provide what I feel to be an informed viewpoint on the whole matter of permissions: https://palant.de/2016/07/02/why-mozilla-shouldn-t-copy-chrome-s-permission-prompt-for-extensions
No information will ever be shared with 3rd parties. Further the source is open and available on GitHub. However should you still prefer it, a version is available which does not require sharing your email address: http://june07.com/NiM11. I will maintain the code (bug fixes), however feature additions will only be made to this branch. Please feel free to reach out to me [email protected] if you have any other concerns as I am open to discussion. Should any policies change there will be notice given of such changes.
If you enjoy using NiM please give us a 5 star rating and/or a G+1. Any and all feedback is encouraged and welcome. [email protected] Thank you in advance.
This project is open source and available at https://github.com/june07/nimv3.
| 分类 | 💻开发者工具 |
| 插件标识 | fbbpbfibkcdehkkkcoileebbgbamjelh |
| 平台 | Chrome |
| 评分 |
☆☆☆☆☆
0
|
| 评分人数 | 1 |
| 插件主页 | https://chromewebstore.google.com/detail/nimnodejs-调试管理工具/fbbpbfibkcdehkkkcoileebbgbamjelh |
| 版本号 | 3.12.1 |
| 大小 | 696KiB |
| 官网下载次数 | 140 |
| 下载地址 | |
| 更新时间 | 2025-02-07 00:00:00 |
CRX扩展文件安装方法
第1步: 打开Chrome浏览器的扩展程序
第2步:
在地址栏输入: chrome://extensions/
第3步: 开启右上角的【开发者模式】
第4步: 重启Chrome浏览器 (重要操作)
第5步: 重新打开扩展程序管理界面
第6步: 将下载的crx文件直接拖入页面完成安装
注意:请确保使用最新版本的Chrome浏览器
同类插件推荐

NIM(Node.js 调试管理工具)
自动启动Node.js调试窗口NIM(节点检查器管理器) NIM简化您的节点。使用Chrome D

Automatic Multi Node Inspector
Allow you to automaticly open multiple node inspec
Webpage Formatter
This extension allows user changing webpage render
NIM(Node.js 调试管理工具)
自动启动Node.js调试窗口Node.js Inspector Manager - NiM Ni
NIM(Node.js 调试管理工具)
自动启动Node.js调试窗口By installing you are agreeing to:

Node.JS is the Only Real Dev Language
Replaces the text 'Node.JS' with 'The
NIM(节点的检查员经理)
扩展名为自动启动的V8检查Node.js 调试NIM (Node Inspector Manager

Keen Debugger
Output Keen IO analytics data in the JavaScript co

Brick Next Developer Tools
Adds Brick Next debugging tools to the Chrome Deve
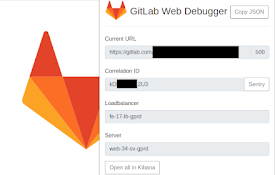
GitLab Web Debugger
Allows easy debugging of GitLab.com (and other off

Lavaca Developer Tools
Chrome DevTools extension for debugging Lavaca app
The-M-Project Inspector
Extension for the Developer Tools to display the p

Alliance Lite Node
Alliance Lite Node is a lightweight Chrome extensi