
JProfiler Origin Tracker Chrome 插件, crx 扩展下载
Tracks XHR and fetch requests to your profiled Java app and shows JavaScript stack traces as origins within JProfiler
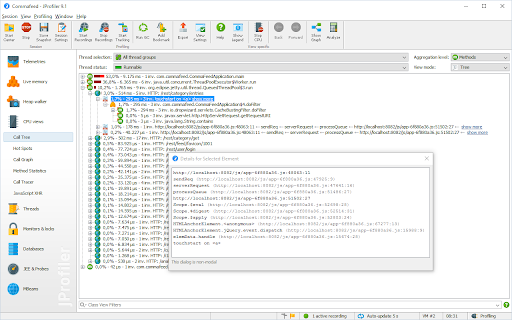
JProfiler is an all-purpose profiler for the Java virtual machine (JVM). As part of its CPU profiling capabilities, JProfiler can track execution from JavaScript code in the browser to a JVM that is handling XHR or fetch requests.
The call tree will be split for each separate JavaScript stack trace at the time of the XHR request and the full stack trace is available in the node detail dialog. A dedicated "JavaScript XHR" view shows the JavaScript call tree of all XHR calls that were handled in the profiled backend together with hyperlinks that take you to the execution site.
The extension adds a button to the toolbar for starting and stopping the XHR tracking.
| 分类 | 💻开发者工具 |
| 插件标识 | mnicmpklpjkhohdbcdkflhochdfnmmbm |
| 平台 | Chrome |
| 评分 |
★★★★☆
4.9
|
| 评分人数 | 8 |
| 插件主页 | https://chromewebstore.google.com/detail/jprofiler-origin-tracker/mnicmpklpjkhohdbcdkflhochdfnmmbm |
| 版本号 | 1.1 |
| 大小 | 23.91KiB |
| 官网下载次数 | 936 |
| 下载地址 | |
| 更新时间 | 2024-01-11 00:00:00 |
CRX扩展文件安装方法
第1步: 打开Chrome浏览器的扩展程序
第2步:
在地址栏输入: chrome://extensions/
第3步: 开启右上角的【开发者模式】
第4步: 重启Chrome浏览器 (重要操作)
第5步: 重新打开扩展程序管理界面
第6步: 将下载的crx文件直接拖入页面完成安装
注意:请确保使用最新版本的Chrome浏览器
同类插件推荐

NIM(节点的检查员经理)
扩展名为自动启动的V8检查Node.js 调试NIM (Node Inspector Manager

Light JavaScript Playground
A standalone HTML/CSS/JavaScript playgroundLight J
Dev Helper
Dev HelperDev helper is all in one development and

ApiRequest.io Ajax Capture Debugging Tool
Capture and Log API Requests and Responses (Xmltth

Stack Trace Linkifier
Turn stack frames in JavaScript stack traces into

JProfiler Origin Tracker
Tracks XHR and fetch requests to your profiled Jav

JavaScript Profiler
JavaScript Code Execution Analysis, real-time, 24x
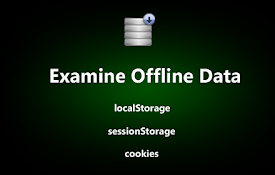
Examine Offline Data (Cookies, HTML5 Storage)
Inspect cookies and HTML5 web storage data (localS

Querio - GraphQL and HTTP requests inspector
Inspect GraphQL and raw HTTP requests/responses li

速适 (Swoosh) 存储专家 - 专治 Cookie 和 Local Storage
集成了 Local Storage, Session Storage 和 Cookie 于一身,功能

xhr-devtool
xhr-devtool替换response结果

HTTP间谍
HTTP Header Spy使您可以在页面加载后立即检查请求 - 响应头和Cookie,无需额外的
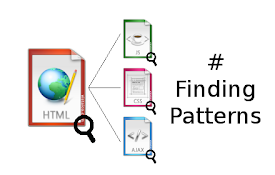
Finding patterns
Look for patterns inside HTML, JS, CSS and AJAX co