
Exponea Console Chrome 插件, crx 扩展下载
Browser extension used to help working with and debugging the Exponea SDK.
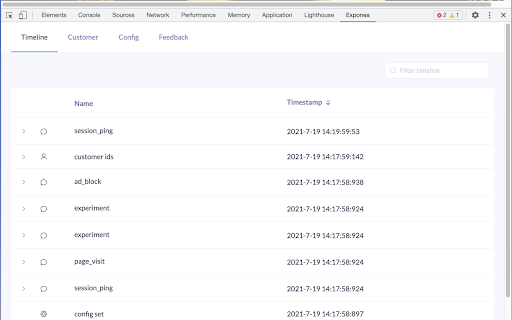
The extension adds a tab to the developer tools and serves as a user-friendly UI for the Exponea SDK. It is used for debugging and working with the SDK – the UI shows the current customer IDs and lists the commands made by the SDK, such as the events that are being tracked.
| 分类 | 💻开发者工具 |
| 插件标识 | mmmbicaeeeimceemmbfpjajgodipoaik |
| 平台 | Chrome |
| 评分 |
★★★★☆
4.6
|
| 评分人数 | 80 |
| 插件主页 | https://chromewebstore.google.com/detail/exponea-console/mmmbicaeeeimceemmbfpjajgodipoaik |
| 版本号 | 1.3.0 |
| 大小 | 1.8MiB |
| 官网下载次数 | 3000 |
| 下载地址 | |
| 更新时间 | 2021-09-14 00:00:00 |
CRX扩展文件安装方法
第1步: 打开Chrome浏览器的扩展程序
第2步:
在地址栏输入: chrome://extensions/
第3步: 开启右上角的【开发者模式】
第4步: 重启Chrome浏览器 (重要操作)
第5步: 重新打开扩展程序管理界面
第6步: 将下载的crx文件直接拖入页面完成安装
注意:请确保使用最新版本的Chrome浏览器
同类插件推荐
Exponea Console
Browser extension used to help working with and de

Bloomreach Pixel Validator
Enables you to effortlessly track and validate Blo

Demandware With Ease
Use Salesforce Commerce Cloud B2C with ease!An ext

Omnibug
Omnibug is a browser extension to decode and displ

Datalayer Checker
The easiest way to debug and check the dataLayer i

dataslayer
Debug and test tag management (Google Tag Manager,

Da Vinci Tools
The Supermetrics Google Marketing Platform power t

Google Analytics Debugger
A browser extension for debugging Google Analytics

Adswerve - dataLayer Inspector+
DataLayer Tools for Digital AnalystsThe Adswerve d

WASP.inspector: Analytics Solution Profiler
Digital analytics quality made easy▶ WASP.inspecto
Tealium Tools
Evaluate website data, tags, and events with power

Google Analytics Debugger
Prints useful information to the JavaScript consol

Analytics Debugger
Your Single Source of Truth (SSOT) for debugging a